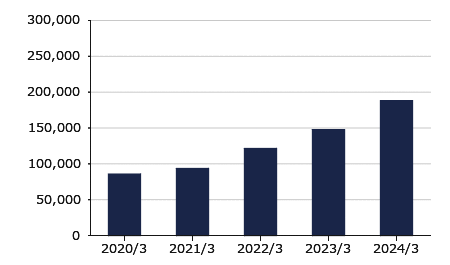
Management Indices (Cash flows)
(Thousand Yen)
| FYE 2021 |
FYE 2022 |
FYE 2023 |
FYE 2024 |
FYE 2025 |
|
|---|---|---|---|---|---|
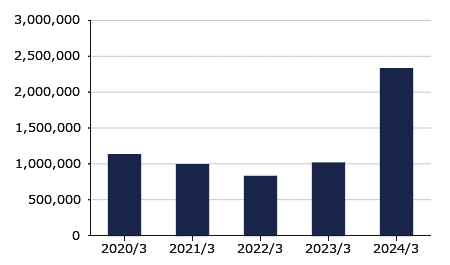
| Cash flows from operating activities | 988,646 | 824,767 | 1,011,233 | 2,328,050 | 2,232,967 |
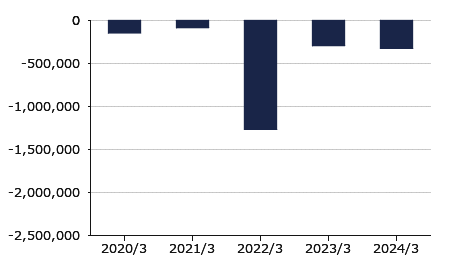
| Cash flows from investing activities | -83,185 | -1,264,136 | -291,898 | -321,750 | -350,965 |
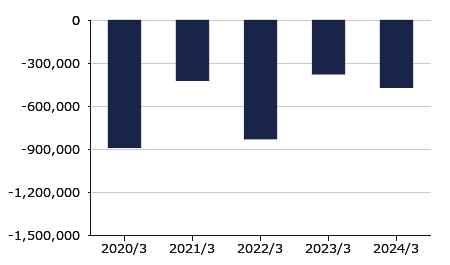
| Cash flows from financing activities | -417,059 | -825,027 | -372,185 | -464,810 | -1,644,239 |
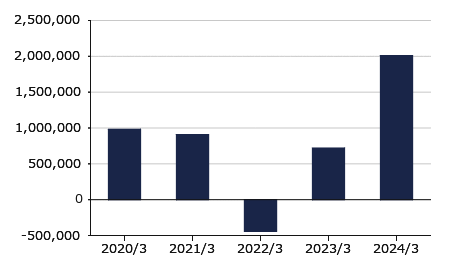
| Free cash flow | 905,461 | -439,369 | 719,335 | 2,006,300 | 1,882,002 |
| Depreciation | 93,439 | 121,337 | 147,511 | 187,686 | 340,838 |
*It is posted based on the financial results after listing (listed on TSE Mothers and Nagoya Stock Exchange Centrex in March 2019).


